

Instructions
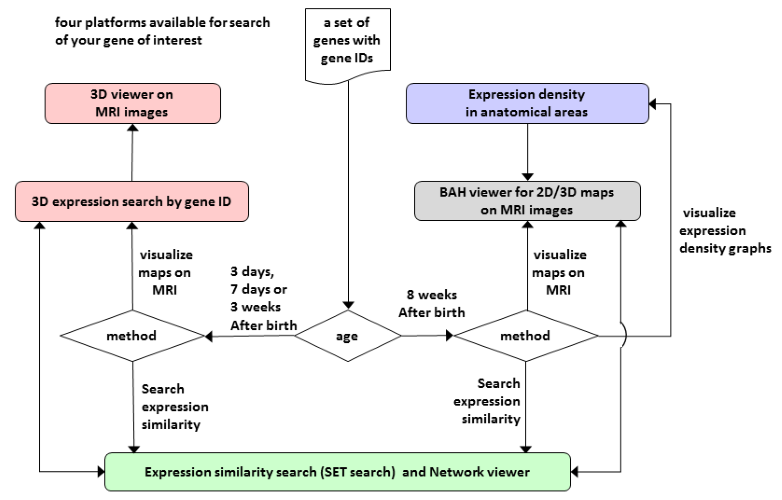
Figure 1 Overview of ViBrism DB
<quick manuals>
- A Quick Instruction manual for 3D Expression Map Search (PDF, 543KB),
 Movie
Movie - A Quick Instruction manual for Expression Density Search (PDF, 371KB), Movie
- A Quick Instruction manual for BAH Viewer (PDF, 489KB), Movie
- A Quick Instruction manual for SET Network Viewer (PDF, 330KB), Movie
<a detail manual>
Contents
1. Materials
1.1 Material selection
ViBrism DB now contains six datasets of the following mouse brains.
(See details about material processing in Instruction Section 1.2)
Select any of your interest, otherwise all materials are searched.
☐ Mouse strains in the normal developmental stages after birth:
- C57BL/6J, 3 days
- C57BL/6J, 7 days
- C57BL/6J, 3 weeks
- C57BL/6J, 8 weeks
☐ Mouse strains of disease models and their controls in the stage after birth
- Huntington disease (HD) model mouse (B6CBA-R6/2 (CAG 120 +/- 5)), 5 weeks
- Control mouse for HD (B6CBAF1/J), 5 weeks
1.2 Material processing for Transcriptome Tomography
1.2.1 Material preparation
ViBrism DB contains datasets of materials produced using the following experimental protocol:
Materials were obtained from animals after anesthetization and treatment with RNA later reagent, and kept frozen. Then, cross-sectioning planes (5 μm) were sequentially produced and their block-face images were obtained using a sectioning machine 3D-ISM. This process was done in each of orthogonal plains.
The datasets were produced with the following brain materials:
| Sectioning directions | Fraction: number | thickness | ||
| C H S | total | |||
| ☐ C57BL/6J, 3 days: | C,H,S | 15+ 8+11= | 34 | 500 μm |
| ☐ C57BL/6J, 7 days: | C,H,S | 10+ 6+ 6= | 22 | 1,000 μm |
| ☐ C57BL/6J, 3 weeks: | C,H,S | 12+ 6+ 10= | 28 | 1,000 μm |
| ☐ C57BL/6J, 8 weeks: | (C,H,S) x 2 | 13/16+6/7+9/10= | 61 | 1,000 μm |
| ☐ HD model, 5 weeks: | C,H,S | 12+ 6+ 10= | 28 | 1,000 µm |
| ☐ HD control, 5 weeks: | C,H,S | 12+ 6+ 10= | 28 | 1,000 µm |
| * Abbreviation of orthogonal planes: Coronal: C, horizontal: H & sagittal: S | ||||
500- 1,000 μm (5 μm×100- 200 sections in a batch)-thick fractions (material fractions) were collected and used for microarray analyses. This process was performed in 3- 6 mice and resulted in 3- 6 series of sectioning for a total of 22 - 61 material fractions.
1.2.2 Transcriptome measurements
The material fractions were kept frozen in 200 μl of TRI reagent (Ambion). A portion (500 ng) of total RNA extracted from the fraction, treated with Mag-max-96 for Microarrays Total RNA Isolation Kit (Ambion), was used in the microarray experiment with the standard single color protocol (Whole Mouse Genome 012694 or SurePrint G3 Mouse GE 28005, Agilent). Measured intensity values on the microarray platform were per-chip normalized with GeneSpring GX software. Gene probes with at least one ‘present’ flag calling were denoted as total probes. Those probes are enough to detect most coding genes, splice variants and long non-coding (linc) RNAs in the brain.
| Assay platform | Number of total probes | kinds of RNA | |
| ☐ C57BL/6J, 3 days: | 28005 | 43,199 | coding, linc |
| ☐ C57BL/6J, 7 days: | 28005 | 47,544 | coding, linc |
| ☐ C57BL/6J, 3 weeks: | 28005 | 44,721 | coding, linc |
| ☐ C57BL/6J, 8 weeks: | 012694 | 36,558 | coding |
| ☐ HD model, 5 weeks: | 28005 | 46,477 | coding, linc |
| ☐ HD control, 5 weeks: | 28005 | 49,686 | coding, linc |
1.2.3 Mapping gene expression densities in the 3D space
See the mapping schema in the “About ViBrism” section at the top page. Briefly, fraction templates, which show exact the 3D location of the material fractions, were constructed from block-face images. Outline images of the multiple (3- 6) fraction templates were registered to the standard image of the brain obtained by MRI imaging. The registration was done using non-rigid transformation programs in ANTs.
Then, per-chip normalized expression intensity values of microarray analysis in the fractions were assigned to voxels in the transformed fraction templates, mean values in the voxels of the multiple templates were calculated, and linearly converted to 8-bit intensity grades. The values were smoothed by a 7x7x7 median filter twice and visualized in multi-color ranges (multi-color mode). Areas expressing higher than 80 percent of the maximal intensity were indicated using 80% cut-off filter (cut-off mode).
1.2.4 Gene expression map files downloadable from ViBrism DB
- Click MapFileID to download a set of expression maps in a “C”.zip folder for a probe.
-
- C%######.zip folder (ca. 300 KB, unzipped to 22 MB) contains 3 files for
- A%######.vcat: multi-color mode map (10 MB)
E80%######.vcat: cut-off mode map (10 MB)
M80%######.msk: mask of the cut-off areas (2 MB)
- To see the files, a software, V-Cat is required.
- Please download V-cat from “Software” at the top page.
A quick manual is available.
| Number of folders downloadable | MapFileID | |
| ☐ C57BL/6J, 3 days: | 43,199 | Ce0##### |
| ☐ C57BL/6J, 7 days: | 47,544 | Cf0##### |
| ☐ C57BL/6J, 3 weeks: | 44,721 | Cg0##### |
| ☐ C57BL/6J, 8 weeks: | 36,558 | Cx1##### |
| ☐ HD model, 5 weeks: | 46,477 | Cd1##### |
| ☐ HD control, 5 weeks: | 49,686 | Cc1##### |
1.2.5 Gene expression maps viewable with the ViBrism 3D Viewer.
Multiple gene Expression maps (cut-off mode) are able to overlay on the MRI brain image and viewed with the ViBrism 3D Viewer after searching the genes of interest at the top page.
2. Methods for Analysis
2.1 Method selection
One of the two search methods, “Search by Gene Symbol/ID” or “Similarly Expressed Gene Search” needs to be selected. Otherwise, “Search by Gene Symbol/ID” is the default selection.
(See details of the search methods in Instruction Section 2.1.1 and 2.1.2)
2.1.1 Search by Gene Symbol/ID
Gene expression maps are searched by queries (see 2.2). Enter queries and click “search” button. Then, a result will appear as “Gene List” tables (see 2.3) below the “Search” button.
2.1.2 Similarly Expressed Gene Search
Similarly Expressed genes to your Target gene (SET) are searched by Pearson correlation coefficient as a similarity measure. Enter queries (see 2.2) of your target genes and click “search” button. Then, a result will appear as “Gene List” tables (see 2.3) below the “Search” button.
2.2 Queries
Enter at least one query of Gene Symbols, Gene IDs or Probe IDs for the microarray system. At most 100 queries in each window can be searched at a time.
| Examples: | ||
| Gene Symbol: | Nkx, pax, dd | |
| Entrez Gene ID: | 16869,66498, 672284 | |
| GenBank ID: | NM_029002, NM_183248,XM_006499301 | |
| Probe ID: | A_51_P232720, A_52_P478745 | |
Gene Symbols are searched by begins-with match. Incompletely matched IDs are ignored. A space after comma is ignored.
2.3 Gene List
“Gene List” may contain multiple tables.
- To sort the whole lists,
- click arrowheads beside terms of gene information and expression.
- To see “Slice View” of gene expression on MRI images
- click “open”, and then click arrows to move the slice.
- Before “Open 3D View”,
- select genes of interest by checking buttons.
2.4 Gene Expression Index
2.4.1 Index I/D/V
| Examples: | ||||||
| Index | I (Intensity): | mean expression intensity in the fractions | ||||
| VL (very low) | : | 20% | ||||
| L (low) | : | 40% | ||||
| M (medium) | : | 60% | ||||
| H (high) | : | 80% | ||||
| VH (very high) | : | 100% | ||||
| D (Detection): | detection in every brain | |||||
| Y (yes): detect at least one fraction in every brain | ||||||
| N (no): not detected in all fractions in at least one brain | ||||||
| V (Variance): | expression variance measured by CV (coefficient of variation) in the materials of 3 days, 7 days and 3 weeks or by FDR (false discovery rate of evenly expressed genes as variably expressed genes) in the material of 8 weeks | |||||
| CV | FDR | |||||
| L (low) | : | < 0.15 | >= 0.1 | |||
| M (medium) | : | < 0.2 | < 0.1 | |||
| H (high) | : | >= 0.2 | < 0.05 | |||
2.4.2 SET
As a result of similarly expressed gene search, the number of SET (Similarly Expressed genes to your Target gene) is calculated (see Instruction Section 2.1.2). Click the number to see Gene List of SET
3. Ethics Statement
All experiments on animals and their care were performed in accordance with the procedures that the RIKEN Regulations for Animal Experiments approved.
4. Viewer
4.1 3D viewer and 2D/3D map viewer (BAH Viewer)
The 3D viewer on the ViBrism DB platform was originally developed by S. Wemler and M. Morita using WebGL API for rendering interactive 2D and 3D graphics of living materials such as the mouse brain.
BAH Viewer was customized to visualize 2D ISH images along with 3D gene expression maps in the MRI image space of the Waxholm space (WHS , C57BL6/J 8-weeks male).
Para-sagittal ISH images of 2,810 genes in the mouse brain were archived from the BrainTx database.
Transformation of the ISH images to fit into the 3D WHS coordinate was done by D. Miyamoto, H. Ikeno and Y. Okamura-Oho in collaborative activity of Brain Atlasing Hackathon (BAH) hosted by NIJC (RIKEN, Japan).
A quick instruction manual for the viewer is available in the <quick manuals> section.
After searching genes of interest as shown in section 2.1.1, multiple gene expression images/maps are visualized in the 3D coordinate space of MRI images.
Images are also seen in obitual sectioning planes and orthogonal planes (see the quick instruction manual for BAH viewer).
4.2 Expression density viewer in anatomical areas
Gene expression densities in the 8 weeks-male-mouse brain were measured with the TT method, re-calculated in the 35 anatomical areas and shown as bar graphs. We use anatomical area maps of the WHS for defining the 35 areas. This platform links to BAH Viewer. A quick instruction manual in PDF is available in the <quick manuals> section.
4.3 SET Network Viewer
Gene lists of SET, searched as shown in section 2.4.2, are visualized as tables and co-expression networks. Multiple networks can be stocked and subjected to calculation of sum or intersect. Network link tables are downloadable. A quick instruction manual in PDF is available in the <quick manuals> section.

|
This work by ViBrism DB Platform committee is licensed under a Creative Commons Attribution-ShareAlike 4.0 International License. |